An examination of the cost and utilization of alternative payment models for oral health care over a patient’s lifetime.
By Sean G. Boynes, DMD, MS, Carolyn Brown, DDS, MEd and Eric P. Tranby, MA, PhD
According to a report by the Commonwealth Fund, the United States pays the most for health care and achieves the lowest performance among comparable countries.1,2 In fact, dissatisfaction with U.S. health care continues to shape political talking points. It also encourages disruptive business models and drives demand for greater transparency, accountability and consumerism.3–6 This changing health ecosystem also affects dentistry. Agencies, organizations and care teams are shifting operational and financial constructs to better align with the changing health care landscape. Currently, the transition includes a switch from a silo-based construct driven by tertiary care to a person-centered format based on inclusive, holistic health care and enhanced quality of life.7–11
Dentistry focuses a significant amount of study and resources on the prevention of disease and health promotion; however, most business models within dental care delivery and benefit design focus on volume and surgical intervention to stabilize disease. These models lack accountability for health outcomes over time.12 To shift to a more value-over-volume and outcomes-oriented approach, Medicaid agencies, as well as employers purchasing dental benefits, are activating cost-control measures and benefit redesign. In 2016, the Center for Health Care Strategies noted “states may be able to use their purchasing power to encourage better access, quality and accountability in oral health care for children in Medicaid — particularly through contracting with dental plans.”13 In fact, many state Medicaid agencies are utilizing alternative payment models (APMs) to drive improvements in oral health care.14–17
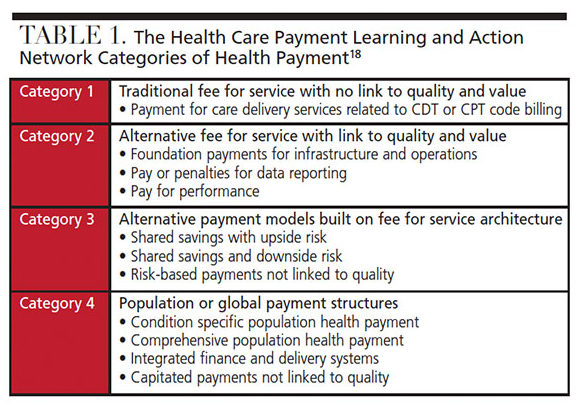
These APMs involve a range of reimbursement or payment structures that utilize either a fee for service (FFS) or capitation payments with incentives to achieve measurable health goals. As seen in Table 1, the Health Care Payment Learning and Action Network utilizes four categories of payment to help define the current health care payment structure.18 Category 1 represents FFS models that pay care providers based on individual procedures or services rendered. Categories 2 through 4 represent alternative models that involve compensation arrangements that include pay for performance, FFS with quality control, or capitated models that incentivize or withhold payments for achieving (or failing to achieve) quality and care goals.
This article will evaluate spending and utilization comparing FFS-based Health Care Payment Learning and Action Network (HCP-LAN) Category 1 to APMs in Medicaid (HCP-LAN categories 2 to 4, collectively), utilizing big data and a unique lifespan analysis.
METHODOLOGY
The analysis presented here examines spending on dental care over the lifespan (ages 0 to 89) in FFS and APMs in a national Medicaid dataset for the years 2013 and 2017. The analysis utilizes a nationally representative sample containing all Medicaid claims from 13 de-identified states obtained from the IBM Watson Medicaid MarketScan Database (ibm.com/us-en/marketplace/marketscan-research-databases) totaling 17.8 million enrollees and 60 million dental claims made by more than 7.7 million patients. (The Western Institutional Review Board granted an exemption for the purposes of this study.)
Costs are calculated using a net payment variable that reflects the actual amount reimbursed to the provider. All costs are inflation-adjusted to 2017 dollars. Mean spending is calculated by dividing the total spent in that category by the number of patients with a dental claim at each year of age. Dental utilization is calculated by dividing the total number of patients with a dental claim by the total number of enrollees at each year of age. The majority of analysis focuses on dental claims, which are identified by the American Dental Association’s Code on Dental Procedures and Nomenclature (or CDT) codes.19 Part of the analysis includes hospital visits for dental conditions that are identified using dental diagnosis codes, oral cancer diagnosis codes, and prescription drug costs for dental conditions.
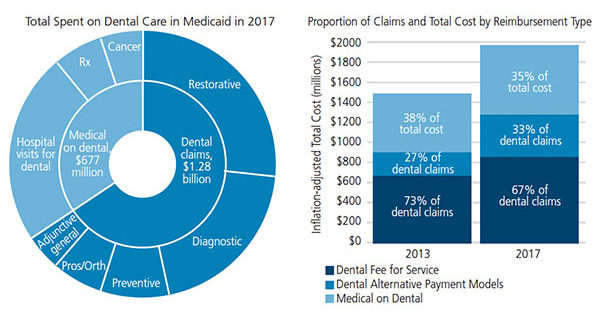
FIGURES 1A and 1B. Estimated total spent on dental care, plus medical costs for dental care in Medicaid, 2013 to 2017.
TOTAL SPENDING ON DENTAL CARE
Within this data, the total spent on oral health within the national Medicaid sample for 2017 was $1.96 billion. As seen in Figure 1, $677 million was spent by medical benefit plans on dental care for outpatient or inpatient hospital visits for dental conditions, treatment of oral cancer, or prescription drugs. By comparison, spending from Medicaid and dental benefit plans on dental procedures performed in a dentist’s office or by an oral health care team was $1.28 billion.
A comparison of proportion of claims and total cost by reimbursement type was completed by comparing the IBM MarketScan data from 2013 and 2017. In 2017, approximately 33% of all dental procedure claims were made in an APM, compared to 27% in 2013.
Average per Patient Spending Over a Lifespan — An individual’s health status (and thus, need for health care access and utilization) is variable over a lifetime.20 In addition, the distribution of health care costs relates to the age distribution of those participating in a given plan or network.21 As reflected in Figure 2A, the overall spending average in 2013 was $387 per patient in FFS reimbursement models, and $182 per patient under an APM arrangement. In 2017, the overall spending average of this cohort was $377 per patient in FFS models, and $282 per patient with an APM (Figure 2B). The analysis shows APMs resulted in less spending each year of life evaluated, except those 0 to 2 years of age in 2017.
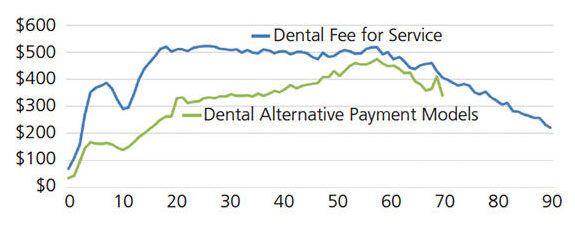
FIGURE 2A. Average per patient spending on dental care in Medicaid, by age and plan type, 2013. (Note: Individuals age 70+ in alternative payment models are excluded from the figure due to sample size limitations.)
Utilization Over a Lifespan — Utilization rates, or the proportion of all enrollees accessing care, are evaluated to determine how groups or individuals are accessing and participating in health care. Figures 3A and 3B compare utilization rates in FFS and APM models in 2013 and 2017, respectively. In both 2013 and 2017 and regardless of payment model, dental care utilization occurs at higher rates during adolescent and early teenage years, with a lifetime peak in utilization at 8 years of age. In 2013, FFS models had higher utilization rates among children, while APMs had slightly higher utilization rates among adults. In 2017, APMs demonstrated more utilization over a lifespan compared to FFS models.
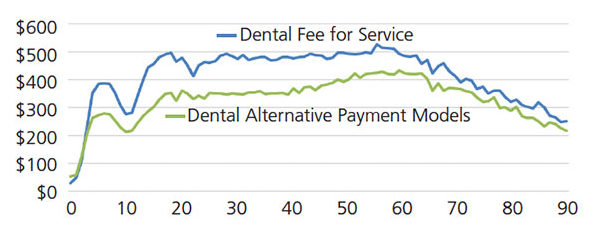
FIGURE 2B. Average per patient spending on dental care in Medicaid, by age and plan type, 2017.
The CHANGING ORAL CARE ENVIRONMENT
The adoption and implementation of APMs in dentistry is often associated with or follows paradigm shifts that impact the entire health care ecosystem.22–24 Today’s dental care teams must navigate a panacea of different payment and reimbursement structures; this requires improved knowledge of not just driving revenue, but also reducing overall costs. This analysis found an approximate 6% increase (from 27% to 33%) in dental claims associated with APMs from 2013 to 2017. The costs over the lifespan for APMs were lower than traditional FFS models, while utilization was better in the APM plans.
Appropriate service utilization is the main driver of success for any financial or operational oral health model. Dental utilization in this sampling was highest during pediatric care and sharply declines within the 20s, before remaining low for the rest of the lifespan. The drive in pediatric utilization is most likely due to changes in pediatric benefit design, pediatric dental care becoming a mandated care provision in the Affordable Care Act, better pediatric access, and changes in health policy.25 The American Dental Association’s Health Policy Institute notes an overall increase in pediatric dental utilization in Medicaid year over year from 2006 to 2016.26
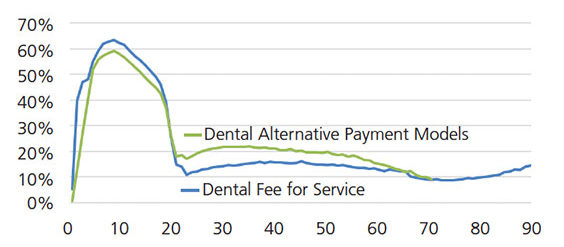
FIGURE 3A. Dental service utilization, by age and plan type, 2013.
It is also notable that by 2017 utilization was higher with APMs than traditional FFS models. This is due to both decreasing utilization of dental services in FFS plans and increasing utilization of dental services in APMs. A Kaiser Family Foundation report on state Medicaid budget years 2018–2019 cites state policy changes in response to federal health policies as the main driver, yielding a shift to managed care and prepaid health plans across many state dental Medicaid programs.27 Implementation of an APM plan includes quality and incentivized payment or bonus opportunities for utilization, specific metric capture and improvement, and patient engagement. Additionally, various financial options for APMs exist, such as payment bundles or episodes.28
It should also be noted that many factors impact utilization. According to the National Academies of Science, Engineering and Medicine, “Health status and need for health care to improve or maintain health are major determinants of health care utilization. Ideally, need should be the major determinant of health care utilization, but other factors are clearly involved, such as the ability to access care — including whether it is available, timely and convenient, and affordable.”29 In addition, the social determinants of health — such as location of residence relative to care, access to reliable transportation, access to healthy food alternatives, and other socioeconomic factors — all influence utilization. Some Medicaid-managed care contracts are beginning to address the social determinants of health, and additional research is needed to understand these plans’ effectiveness.30
There are limitations to this analysis, of course. Because the study is based on claims data, the findings reflect only those who accessed health care for a dental procedure or presented with a dental diagnosis. As the data is constructed to provide markers for two payment types (FFS and APM), it was not possible to evaluate the type of APM design or financial structure. Also, individual state data cannot be extracted from the dataset. And because the Medicaid claims data used in these analyses came from two distinct years from 13 de-identified states, confounding factors — such as state-level health policy changes and specific Medicaid enhancement or restrictions instituted during this time — were not analyzed.
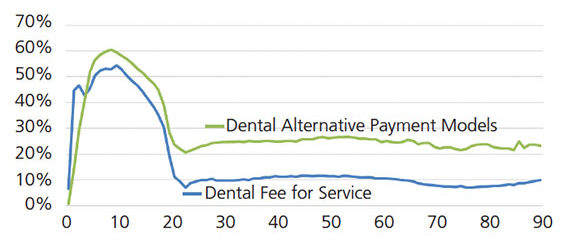
FIGURE 3B. Dental service utilization, by age and plan type, 2017.
CONCLUSION
Changes in the overall health care system have a direct impact on dentistry. From 2013 to 2017, the data show an increase in the number of Medicaid APM claims, with lower spending over the lifetime than FFS plans. Utilization of dental services under APMs also improved from 2013 to 2017, surpassing utilization with a traditional FFS model. As the health care landscape continues to evolve, APMs for dental treatment are increasingly being used to control costs and incentivize utilization, access and quality care — and thus improve health outcomes. Further study of policy implications and Medicaid dental utilization, specifically at the state level, is warranted to further understand the early impacts of dental managed care and APM models.
Acknowledgments: The authors thank Alison Corcoran, chief marketing officer, DentaQuest, for her critical thinking and leadership in developing prevention-focused alternative payment models in dentistry. The authors also thank Dr. Julie Frantsve-Hawley, director of analytics and evaluation at the DentaQuest Partnership, for her thoughtful scholarly contributions to this study, as well as Mr. Ilya Okunev and Dr. Yara Halasa-Rappel for their contributions to the analysis.
REFERENCES
- Schneider EC, Sarnak DO, Squires D, Shah A, Doty M. Mirror, Mirror 2017: International Comparison Reflects Flaws and Opportunities for Better U.S. Health Care. Available at: https://www.commonwealthfund.org/publications/fund-reports/2017/jul/mirror-mirror-2017-international-comparison-reflects-flaws-and. Accessed December 5, 2019.
- Osborn R, Squires D, Doty MM, Sarnak DO, Schneider EC. In new survey of eleven countries, U.S. adults still struggle with access to and affordability of health care. Health Aff (Milwood). 2016;35:2327–2336.
- Novilla M, Lelinneth B, Goates M, Galvao L, Quintana NM. Navigating the politics of health: a systematic review of U.S. policymakers’ views on the social determinants of health, health disparities, health equity, and health in all policies. Faculty Publications. 2018:2102.
- Vayena E, Dzenowagis J, Brownstein JS, Sheikh A. Policy implications of big data in the health sector. Bull World Health Organ. 2018;96:66–68.
- Christensen CM, McDonald R, Altman EJ, Palmer JE. Disruptive innovation: an intellectual history and directions for future research. J Manag Stud. 2018;55:1043–1078.
- American Dental Association. 2019 Annual Dental Industry Report. Available at: https://ebusiness.ada.org/productcatalog/61754/HPI%20Industry%20Reports/AD2019?utm_source=adaorg&utm_medium=hpi-alert&utm_content=hpiannualreport. Accessed December 5, 2019.
- Casamassimo PS, Flaitz CM, Hammersmith K, Sangvai S, Kumar A. Recognizing the relationship between disorders in the oral cavity and systemic Pediatr Clin North Am. 2018;65:1007–1032.
- Boynes SG, Davis LA, Adams G, Mills M, Deutchman M. MORE care: Narrowing the rural interprofessional oral health care gap. Boston: DentaQuest Institute. 2017.
- World Health Organization. What is the burden of oral disease? Available at: http://www.who.int/oral_health/disease_burden/global/en/. Accessed December 5, 2019.
- FDI World Dental Federation. Oral Health Worldwide. Available at: https://www.fdiworlddental.org/resources/white-papers/oral-health-worldwide. Accessed December 5, 2019.
- Shariff JA, Edelstein BL. Medicaid meets its equal access requirement for dental care, but oral health disparities remain. Health Aff (Millwood). 2016;35:2259–2267.
- Vujicic M. Our dental care system is stuck: and here is what to do about it. J Am Dent Assoc. 2018;149:167–169.
- Leddy T, McGinnis T, Howe G. Value-Based Payments in Medicaid Managed Care: An Overview of State Approaches. Available at: https://www.chcs.org/media/VBP-Brief_022216_FINAL.pdf. Accessed December 5, 2019.
- Snyder A, Kaye N, Mention N. Managed Care for Medicaid Dental Services: Insights from Kentucky. Available at: http://www.nashp.org/wp-content/uploads/2016/04/Managed-Care-Brief.pdf. Accessed December 5, 2019.
- National Academy for State Health Policy. Oral Health and Triple Aim Toolkit. Available at: https://nashp.org/oral-health-toolkit/. Accessed December 5, 2019.
- U.S. Centers for Medicare & Medicaid Services, Benefits, Dental Services, Oral Health Performance Improvement Projects. Available at: https://www.medicaid.gov/medicaid/ benefits/downloads/keep-kids-smiling.pdf. Accessed: December 5, 2019.
- American Dental Association. Medicaid: Considerations When Working with the State to Develop and Effective RFP/Dental Contract. Available at: http://www.ada.org/~/media/ADA/Member%20Center/Images/Contact%20and%20Connections/ConConnect_ADAMedicaidResourceforStateSocieties_June2015.ashx. Accessed December 5, 2019.
- Health Care Payment Learning and Action Network. Alternative Payment Model (APM) Framework White Paper. Available at: https://hcp-lan.org/apm-refresh-white-paper/. Accessed December 5, 2019.
- American Dental Association. American Dental Association CDT-2017 Code on Dental Procedures and Nomenclature. Available at: https://www.deltadentalco.com/uploadedFiles/ProviderFeeSchedules/DDCO_Par_Provider_Documents/CDT%202017_Code%20on%20Dental%20Proc_Nomenclature%20online.pdf. Accessed December 5, 2019.
- Sawyer B, Claxton G. How do health expenditures vary across the population? Available at: https://www.healthsystemtracker.org/chart-collection/health-expenditures-vary-across-population/#iten-start. Accessed December 5, 2019.
- Alemayehu B, Warner KE. The lifetime distribution of health care costs. Health Serv Res. 2004;39:627–642.
- Rubin MS, Edelstein BL. Perspectives on evolving dental care payment and delivery models. J Am Dent Assoc. 2016;147:50–56.
- Collins RJ, Friedman JW. The future of payment for dental care. Curr Oral Health Reports. 2018;5:147–153.
- Wong CA, Perrin JM, McClellan M. Making the case for value-based payment reform in children’s health care. JAMA Pediatr. 2018;172:513–514.
- Zlotnick C, Tam T, Ye Y. Statewide policy change in pediatric dental care, and the impact on pediatric dental and physician visits. Matern Child Health J. 2017;21:1939–1948.
- American Dental Association Health Policy Institute. Dental Care Utilization Steady Among Working-Age Adults and Children, Up Slightly Among the Elderly. Available at: https://www.ada.org/~/media/ADA/Science%20and%20Research/HPI/Files/HPIBrief_1016_1.pdf?la=en. Accessed December 5, 2019.
- Gifford K, Ellis E, Edwards BC, et al. States focus on quality and outcomes amid waiver changes: results from a 50-state Medicaid Budget Survey for State Fiscal Years 2018 and 2019. Available at: https://www.kff.org/medicaid/report/states-focus-on-quality-and-outcomes-amid-waiver-changes-results-from-a-50-state-medicaid-budget-survey-for-state-fiscal-years-2018-and-2019/. Accessed December 5, 2019.
- Chee TT, Ryan AM, Wasfy JH, Borden WB. Current state of value-based purchasing programs. Circulation. 2016;133:2197–2205.
- National Academies of Sciences Engineering Medicine. Health-Care Utilization as a Proxy in Disability Determination. Available at: https://www.nap.edu/read/24969/chapter/1#ii. Accessed December 5, 2019.
- Crumley D, Lloyd J, Pucciarello M, Stapelfeld B. Addressing Social Determinants of Health via Medicaid Managed Care Contracts and Section 1115 Demonstrations. Available at: https://www.chcs.org/media/Addressing-SDOH-Medicaid-Contracts-1115-Demonstrations-121118.pdf. Accessed December 5, 2019.